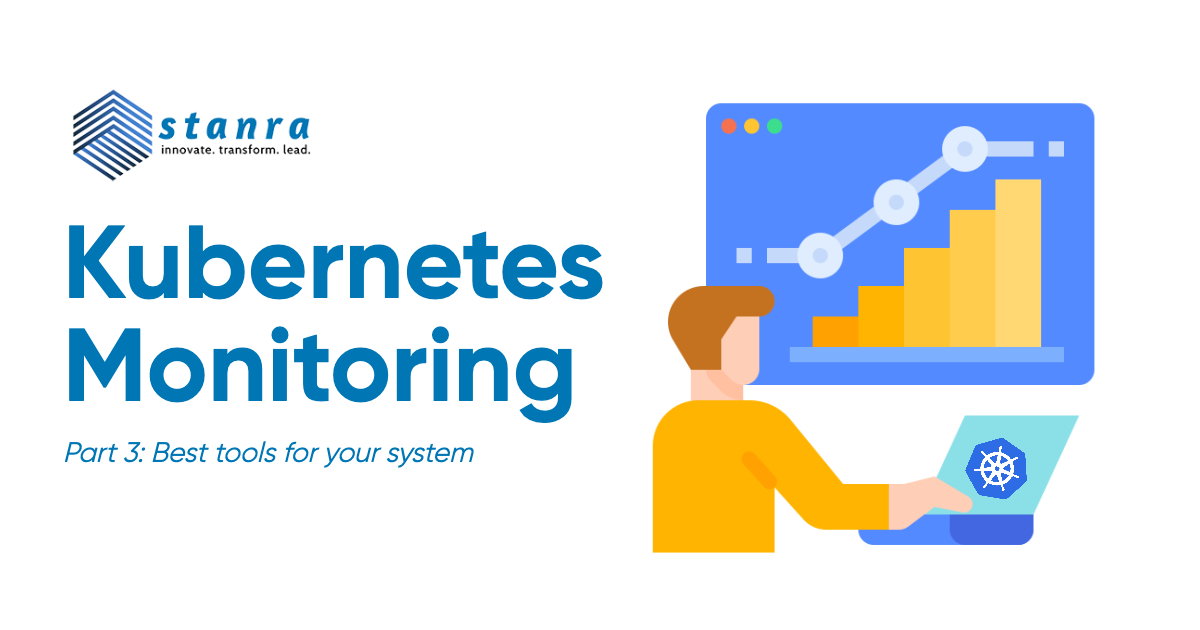
Kubernetes can create layers of abstraction through pods and services that free your production environment from worrying about adequate resources and where your application is running. But at the same time monitoring your entire system becomes difficult. By making the process easier and more automated, there is an increase in the number of metrics and it can become confusing when creating a monitoring system. Beginning the second part of our Kubernetes Monitoring articles, we are going to start with the metrics that you should focus on to create alerts and reports. We have already discussed the challenges faced in Kubernetes monitoring in the last article and we hope to make it much clearer by discussing the metrics and best practices in this article. If you missed the first part, we highly recommend you go through an overview and challenges of Kubernetes monitoring that we discussed here.
Key Kubernetes metrics to track
As we have discussed before, Kubernetes has multiple layers and we have classified our metrics on the basis of those layers. So, we will be going from broader application-level metrics and trickle down to the cluster-level metrics that are essential to track and can reveal a lot of information about your system.
Application
- Request Rate
- Error Rate
- Duration
These metrics will help you understand the availability of your application and also give you an overview of the health and performance. Track these metrics, and create a dashboard to maximize a positive user experience.
Container/Pod
- CPU
- Memory
- Network
By tracking these metrics, we are trying to understand the resource allocation that is essential to keep your application running smoothly without creating any slump in performance and preventing over-provisioning.
Node
- Disk space usage
- Node network traffic
While nodes have their own pre-determined resource capacity limits, adding these metrics to monitoring can describe the status of running nodes.
Control Plane
A control plane consists of multiple components that work together to keep track of various metrics, make scheduling decisions and ensure that the clusters run optimally. While there aren’t any specific metrics to track, you should monitor the various components of this control plane.
Monitoring the Scheduler, API Server, Controller and Etcd would ensure that the control plane works as intended.
Cluster
- Active nodes
- Resource utilization
- Network Pressure
The finest member in the chain can be one of the most essential to help understand and reduce cloud bills while giving you more insights on optimization through the number and size of nodes for optimal functioning.
Kubernetes Monitoring Best Practices
We have discussed the key metrics that you should be tracking to get an overview of your Kubernetes application but that will not be enough for you to derive the maximum business value from it. So, we will be discussing some best practices for achieving optimum efficiency for Kubernetes monitoring.
- Know the Best Metrics for your Application
Every business requirement is a bit different and while two Kubernetes applications might be serving a similar purpose, the customer experience and value to be derived from the application might be entirely different. It is essential to know the metrics that you want to be tracking and to help you out with that, we have already discussed the levels at which you can monitor the application.
- User Experience – First Priority
Any application that you’re building must be serving some customers. The end goal of your application is to let users derive maximum benefit from it. Although the end-user experience is not a part of Kubernetes it is one of the most essential parts of your application.
Collect data via synthesis and real-time monitoring to help you with understanding the interaction between Kubernetes workloads and how the app responds and the users. This should provide you with the pain points of customers and so the application that you need to work on.
- Set Alerts for Under provisioned Resources
Throttling can lead to downtime which ultimately affects the user experience. Any system can go through a high disk utilization problem and Kubernetes is no exception to it. Set alerts for 75% or 80% disk utilization so you can act accordingly when a situation like this occurs. While it is beneficial to keep the resources as close to the optimum load, a slight inconvenience caused by overutilization can disrupt the user experience.
- Automate Issue Detection
As we have discussed, Kubernetes has multiple layers of abstraction which means it will be hard to detect faults at all levels efficiently. You can use API metrics to lower the risks of a fault going unnoticed.
You can enable automatic detection of REST API anomalies which will help these metrics locate any degradation of components in microservices. This would be beneficial in providing full-stack visibility across clusters.
- Monitoring your Cloud Environment
There are certain elements of the cloud that you should keep in check when working with Kubernetes. Identity and Access Management events that log permission changes, logins, etc. Should be well monitored. Monitoring the network performance would make sure that any downtime is prevented. Apart from this, any other connecting element of the cloud provider should be monitored since it can increase your cloud bill.


Leave A Comment